UWTSD Extra Curricular Research Project
3D map to showcase the before and after of a disaster area created as part of an extra curricular project at University.
This project was completed with the help of a team of around 15 members with 3 team leaders.
My role within the project was OSINT team leader which required me to undertake the following to ensure the research needed for the project was completed at a good pace. To do this I created an efficient system for research that made use of spreadsheets, asset lists and careful planning of the research area.
After research was completed, I assisted the other two team leaders to complete the rest of the project. This required me to assist with 3D modeling of buildings and decorations as well as helping with building the map to an accurate level.
While working on this project I made use of the following tools and software:
Blender- Most models created for this project were made in Blender and ported into Unreal.
Unreal - The main map was made within Unreal and featured a fairly detailed overview of the area with the option to swap between pre- and post-disaster.
Excel - As OSINT team leader I made effective use of Excel to create detailed and organized asset lists and area overviews.
Adobe Suite - The main use of this was to present models in a professional manner towards the end of the project.

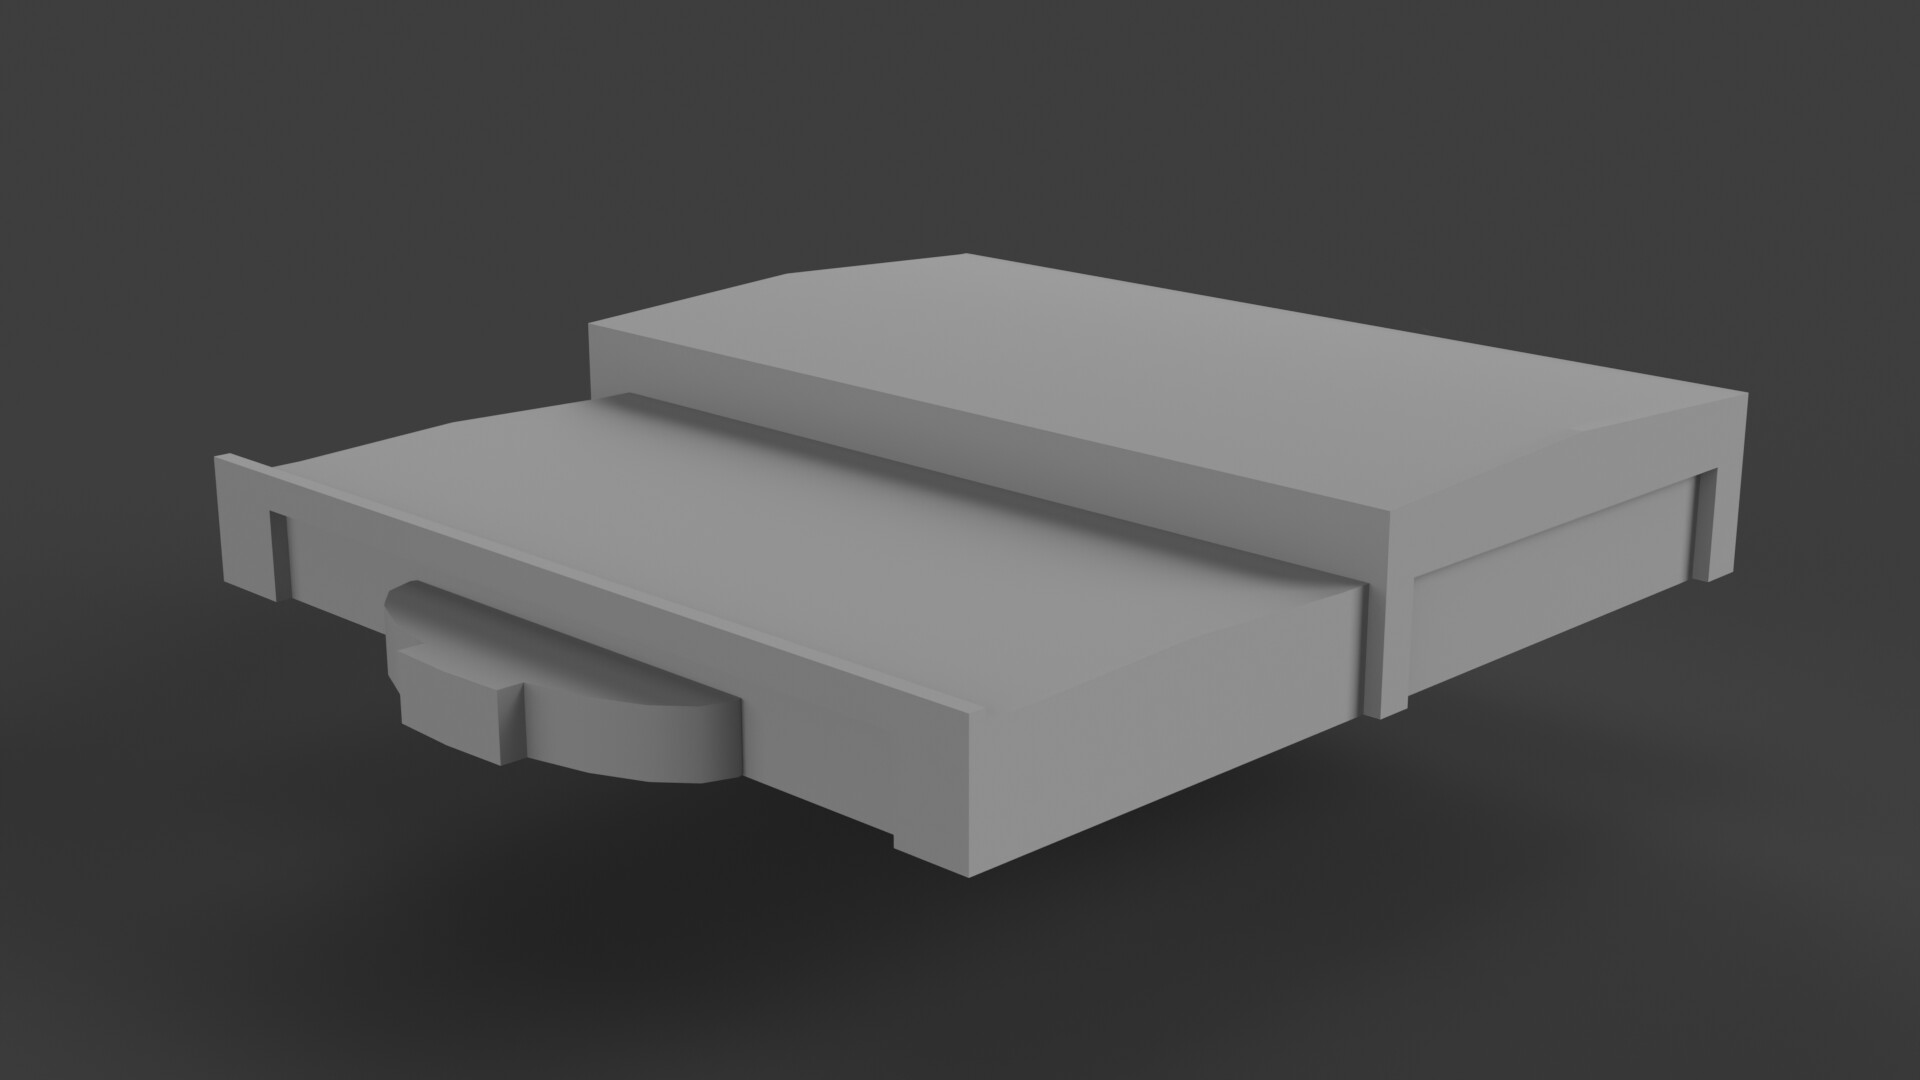
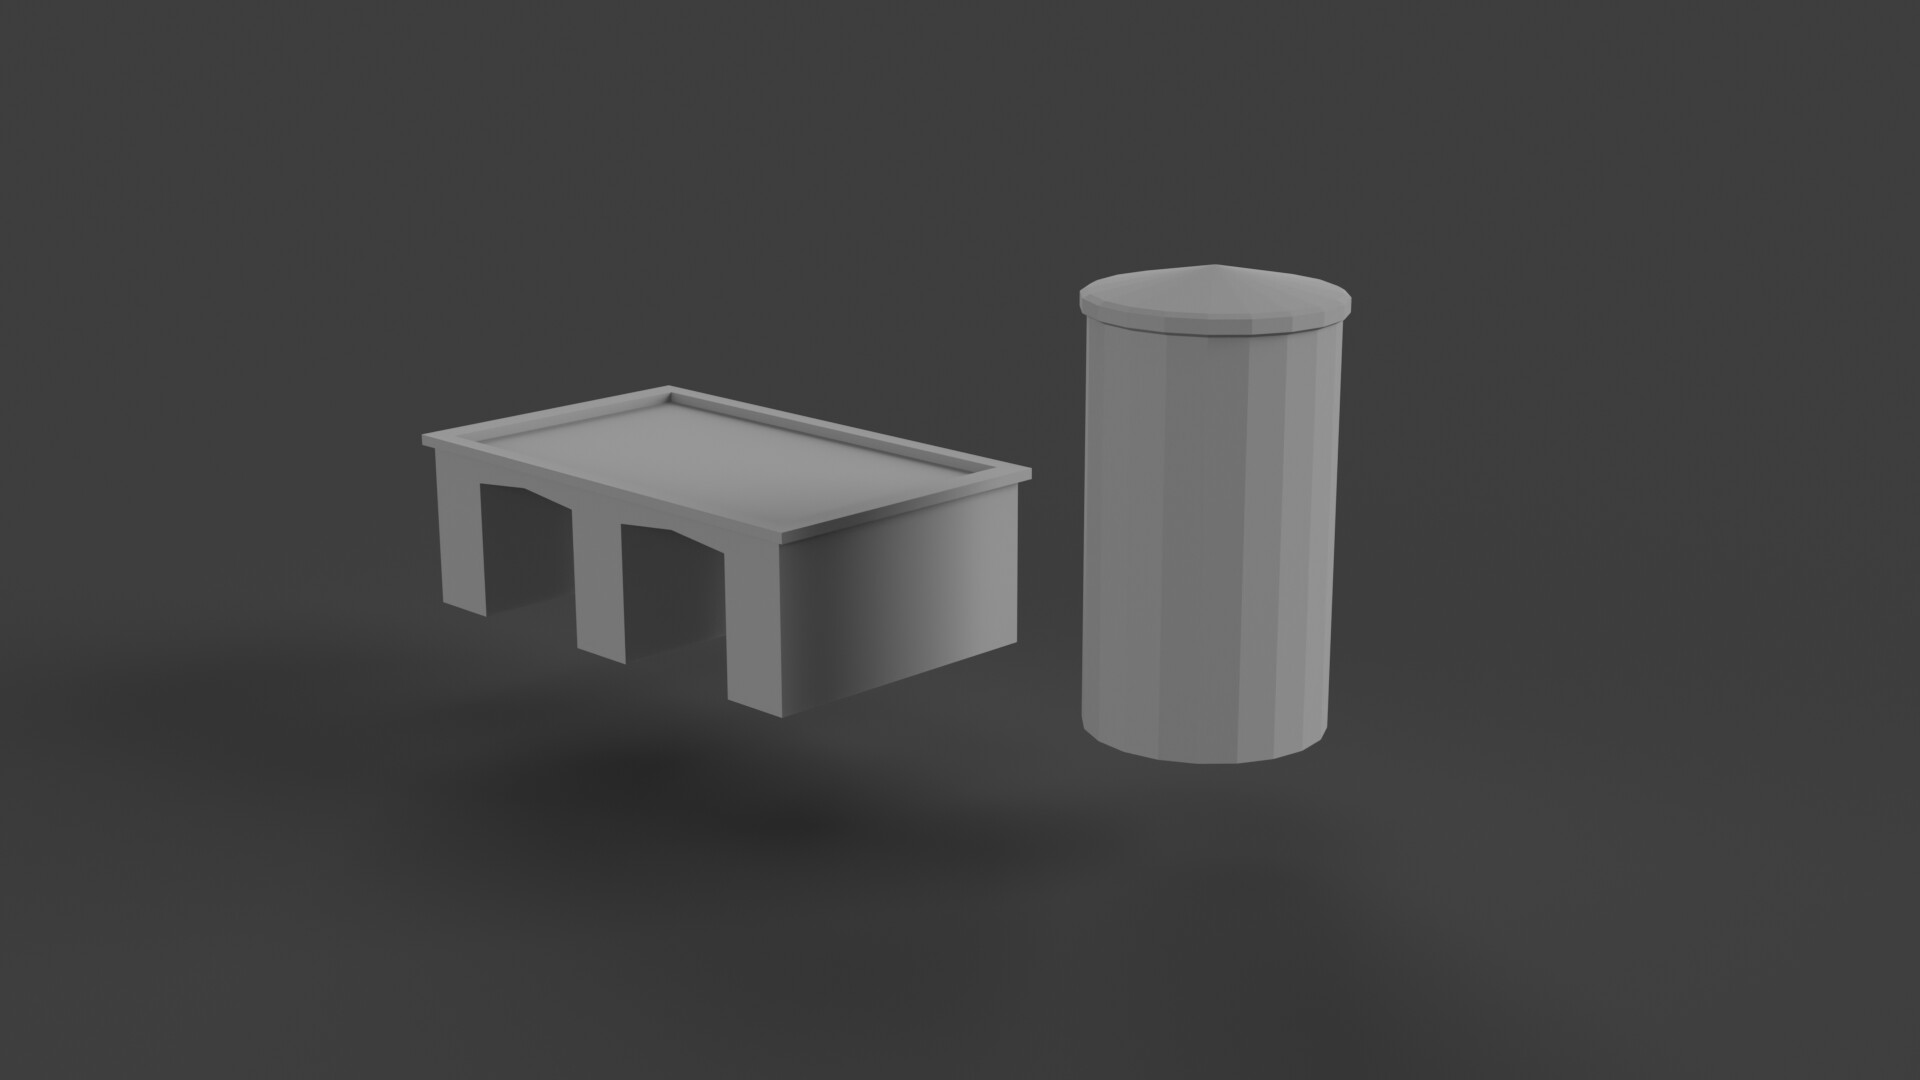
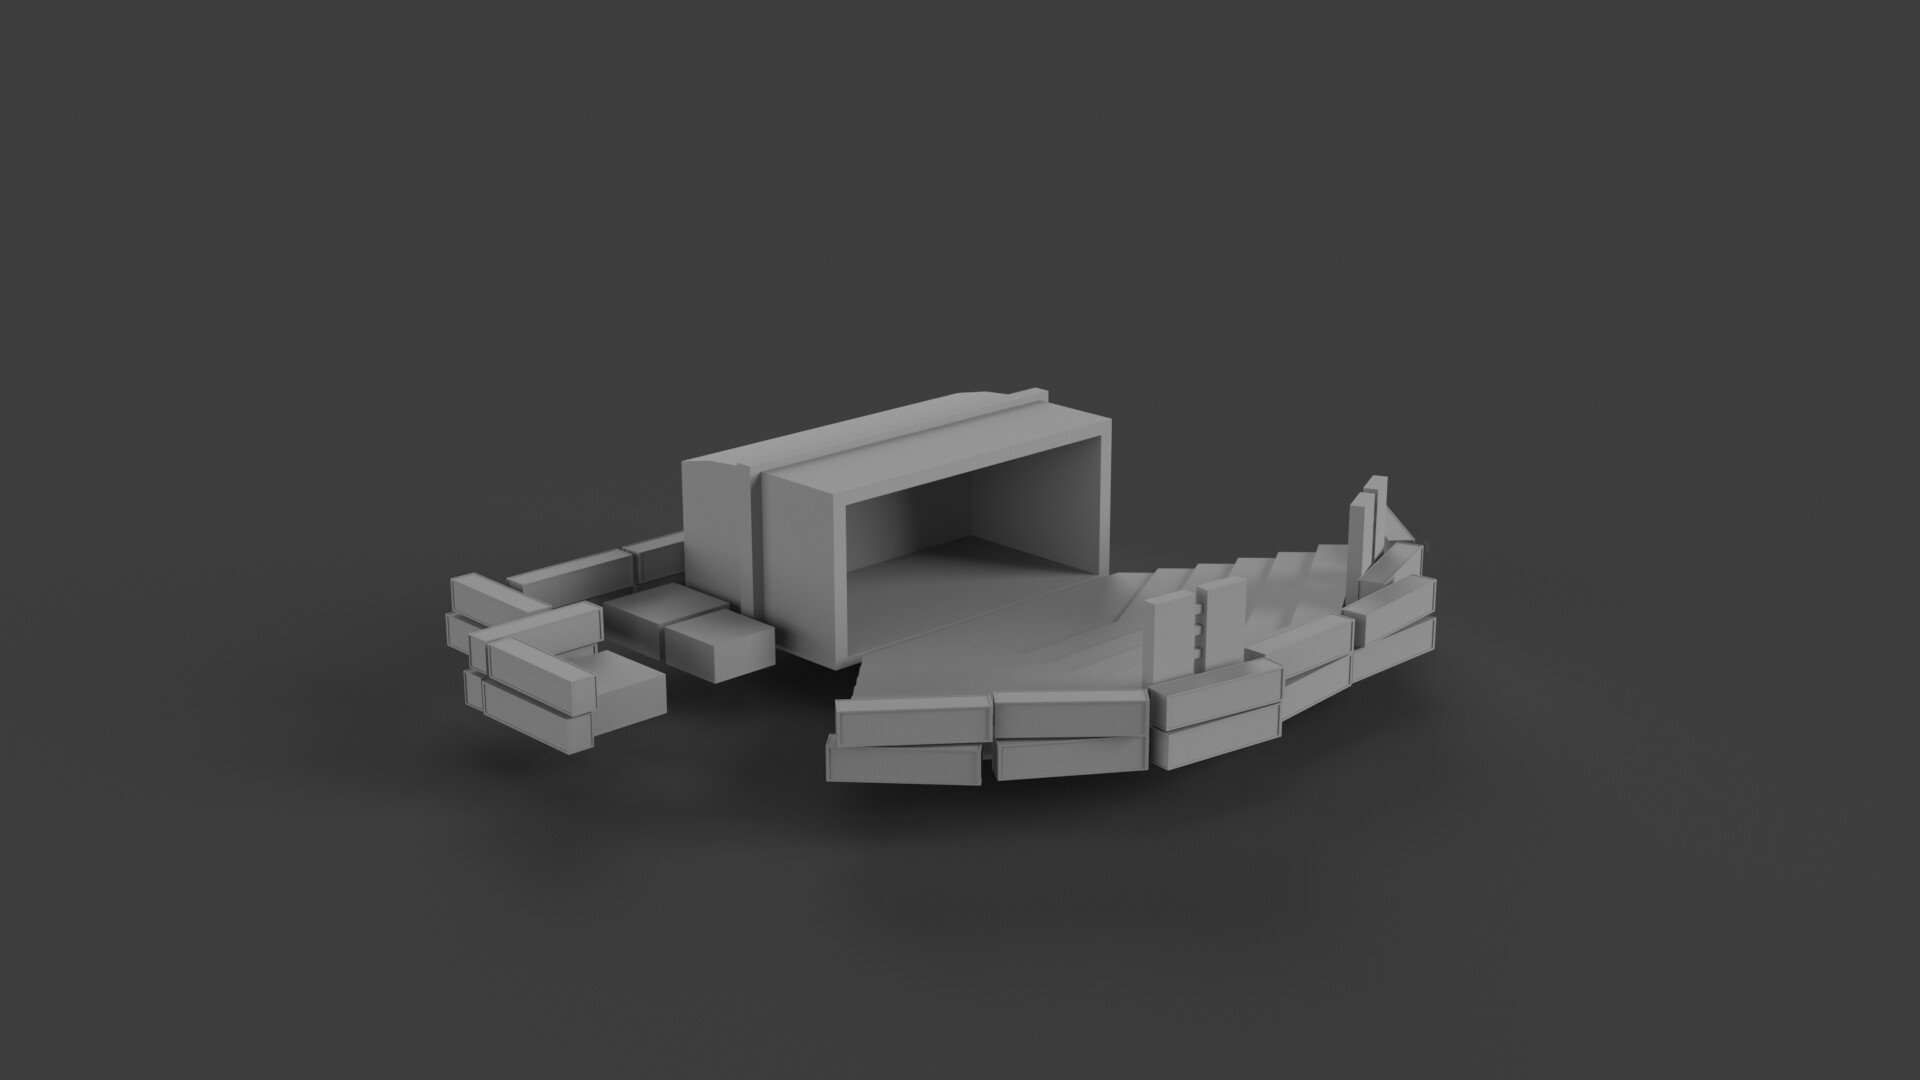
Some of the buildings I worked on. The buildings were made to have the general shape of their real-life counter parts but with no textures on them.